Download Report Below
Mayra Galvez Realtor | DRE 02173887 | mgalvez.realestate@gmail.com | 818-900-2573 | www.homesbymayra.com
Ladies and gentlemen, thank you for joining me today as we delve into the fascinating world of real estate metrics. Whether you are a buyer or seller, understanding these metrics can provide valuable insights into the current market conditions. So, let’s get started!
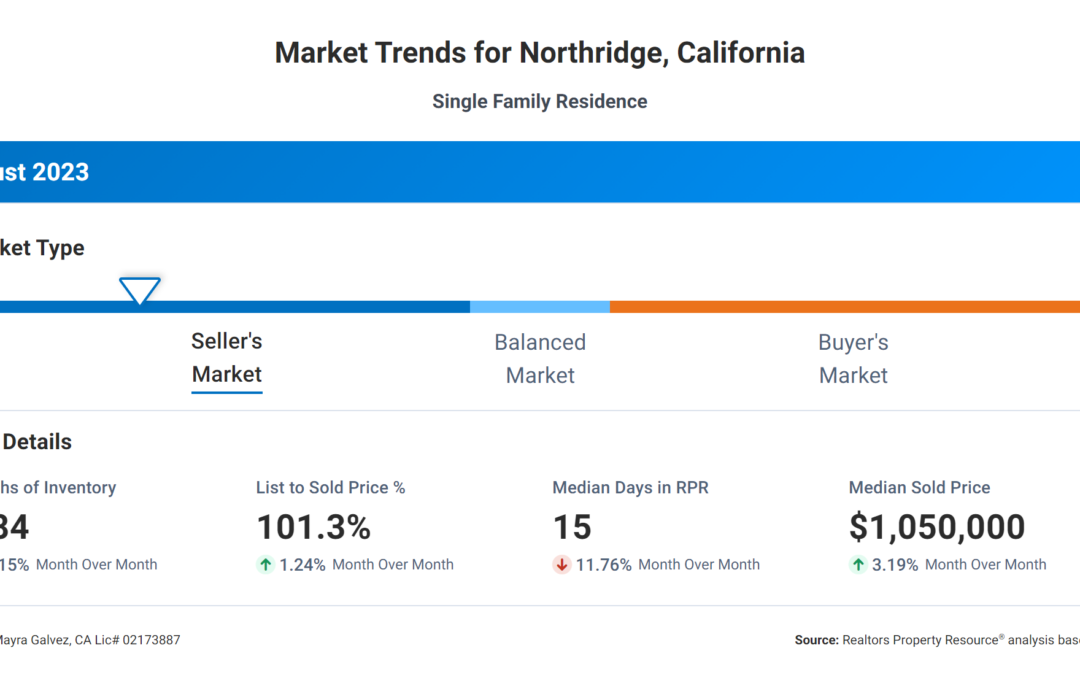
First, let’s talk about the “Months Supply of Inventory,” which currently stands at 1.84. This metric represents the number of months it would take to sell all the homes on the market, assuming no new listings are added. A lower number indicates a seller’s market, where demand outpaces supply. In this case, the low supply suggests that there are more buyers than available homes, potentially leading to increased competition and higher prices.
Next, let’s focus on the “12-Month Change in Months of Inventory,” which shows a significant decrease of -26.4%. This metric provides an essential perspective on the market’s volatility and direction. The negative change suggests a shrinking inventory over the past year, further reinforcing the current seller’s market conditions we mentioned earlier. Sellers can take advantage of this trend by potentially receiving multiple offers and selling their properties faster.
Moving on, we come to the “Median Days Homes are On the Market,” which is an incredibly low 15 days. This metric measures the average number of days it takes for a property to go from listing to being under contract. With such a short duration, it’s evident that properties are being snapped up quickly. Buyers need to act swiftly and be prepared to make competitive offers to secure their desired homes. Sellers, on the other hand, can expect a fast-paced selling process with potential bidding wars.
Now, let’s discuss the “List to Sold Price Percentage,” which currently stands at an impressive 101.3%. This metric reveals the percentage at which homes are selling compared to their initial asking price. The percentage above 100 indicates that homes are selling for more than their list price, which is excellent news for sellers. It suggests a highly competitive market where buyers are willing to pay a premium to secure their dream homes.
Lastly, we have the “Median Sold Price,” which sits at a substantial $1,050,000. This metric represents the middle value of all the homes sold in the market during a specific period. The high median sold price indicates a robust and affluent market where buyers are willing to invest in high-value properties. Sellers can expect to fetch top dollar for their homes, given the strong demand and limited supply.
In conclusion, these real estate metrics paint a vivid picture of a competitive seller’s market. Buyers should be prepared for limited options and potentially paying above asking price to secure a property. Sellers, on the other hand, can expect a fast-paced selling process with the potential for multiple offers and premium prices. As always, it’s essential to consult with a professional real estate agent who can provide personalized guidance based on your specific needs and goals.
Thank you for your attention, and I wish you all the best in your real estate endeavors!
Mayra Galvez Realtor | DRE 02173887 | mgalvez.realestate@gmail.com | 818-900-2573 | www.homesbymayra.com
Stay up to date on San Fernando Valley & Santa Clarita Valley Housing Trends by signing up to my newsletter
